Update Date: October - 2023
Carlos Alegria
Download full report (pdf) PDF Report
Navigation to related reports:
Country: UK
Period: Yearly data from 2010 to 2022.
Cause of Death Data
The data used in this analysis is the number of deaths that occurred in England and Wales between 2010 and
2022, by underlying cause code (ICD-10), sex, and age group (up to 90+). The source is the UK Office for
National Statistics (ONS). The direct links to the mortality data by cause for 2010 to 2021 and 2022 are listed
below:
Link to the ONS 2022 data source: Death occurrences by sex, five year age group and underlying cause (ICD-10 code) England and Wales: 2022
Link to the ONS 2010-2021 data source: Death occurrences by sex, five year age group and underlying cause (ICD-10 code) England and Wales: 2010-2021
UK Monthly Registered Deaths (All cause) Deaths registered monthly in England and Wales
Information regarding ONS cause of death statistics:
Analysis of the most common cardiovascular diseases:
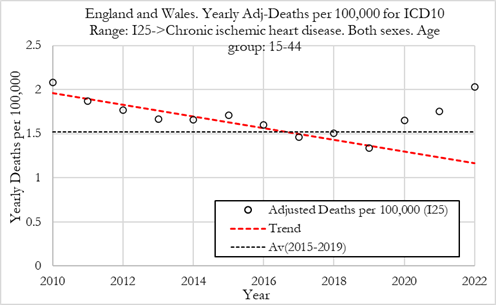
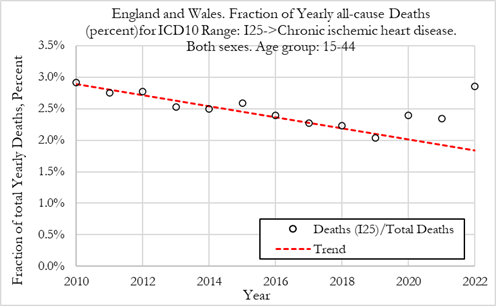
In this section we investigate the trends in death rates for ICD10 code I25 (Chronic ischemic heart disease), which represents 21.8% of all cardiovascular deaths in 2019 for 15 to 44 year-olds in the UK. This analysis investigates the absolute trends in adjusted deaths for a single ICD10 code. We also investigate the fraction of deaths attributable to ICD10 code I25 versus deaths from all other causes.
The methdology for establishing the baseline is described in full report.
The Figures below show yearly adjusted deaths for Chronic Ischemic Heart Disease for females in England and Wales. The red dashed line shows the average from 2010 to 2019. The dotted line shows the 2015-2019 average death rate. Left: Adj-Deaths per 100,000. Right: Adj-Deaths (number).
Summary:
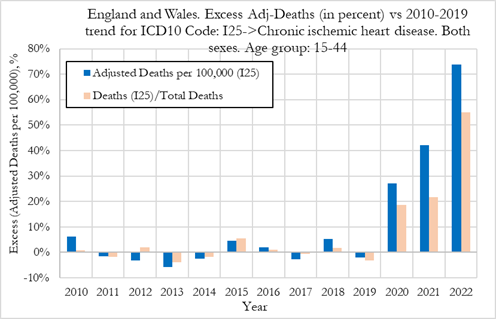
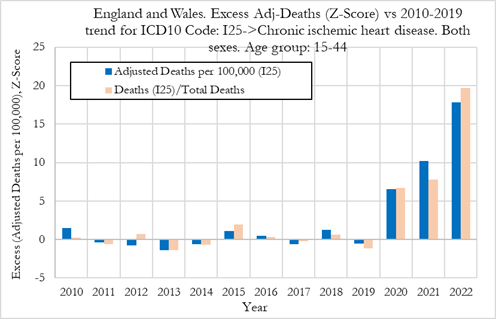
In the Figure (left) below we can observe that the excess deaths rates from chronic ischemic heart disease were +28% in 2020, then rose to about 42% in 2021 and about 74% in 2022. In terms of statistical significance of the excess deaths, we observe from Figure 10 (right) that for these cardiovascular conditions, in 2021, the Z-score for excess adjusted death rates was about 10 which points to a very strong signal (extreme event) that needs further investigating. In 2022 the Z-score rose to about 17, which is an extraordinarily strong signal and indicates that the excess deaths from chronic ischemic heart disease are statistically significant deviations from the 2010-2019 trend. We also note that in 2020, the Z-score for the excess death rates was already pointing towards a strong signal.
When looking at changes in the fraction of all deaths attributed to chronic ischemic heart disease, we observe that the fraction of deaths for these conditions were +18% and +22% above trend in 2020 and 2021, respectively (with a Z-score around 6, indicating high statistical significance). In 2022 however, the fraction of deaths for these conditions jumped about +55%, with a Z-score above 19 which points to a strong effect (extreme event).
Summary:
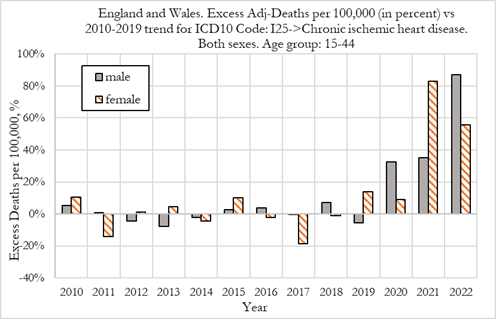
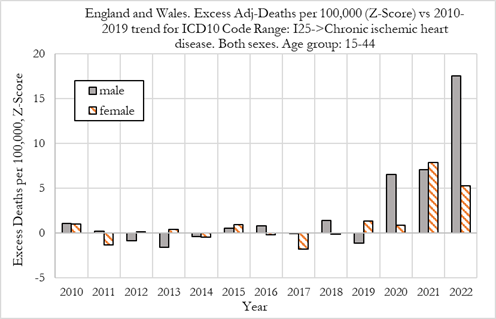
We now compare excess deaths rates from chronic ischemic heart disease for males and females aged 15-44, as shown in the Figure below.
We observe that in 2020 while female had no noticeable excess mortality (with a Z-scores below 1.0), men already experience about 33% excess mortality (with a Z-score above 6 which denotes very high statistical significance).
We also observe that in 2021 women suffered worse outcomes than men, with women experiencing a 82% deviation from trend, compared to about 36% for men. These values are strong signals, with Z-scores above 6.
In 2022, men suffered worse outcomes than women, with men experiencing about 86% deviation from trend, compared to about 56% for women. The signal strength for men was very strong (with a Z-score of close to 18) and for women the signal was also very strong signals (albeit with a lower Z-score of about 5), as shown in Figure (right).
Summary:
In this section we investigate the trends in death rates for ICD10 code I21 (Acute Myocardial infarction), which represents 18.2% of all cardiovascular deaths in 2019 for 15 to 44 year-olds in the UK. This analysis investigates the absolute trends in adjusted deaths for a single ICD10 code. We also investigate the fraction of deaths attributable to ICD10 code I21 versus deaths from all other causes.
The methdology for establishing the baseline is described in full report.
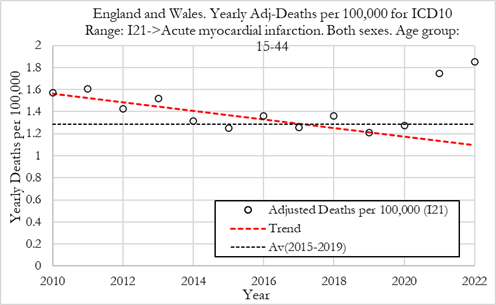
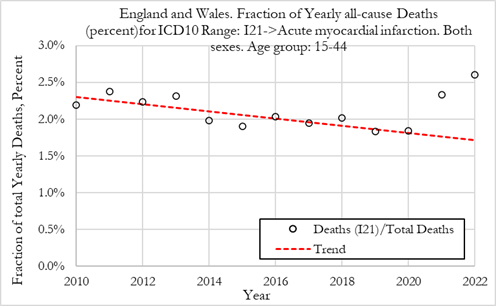
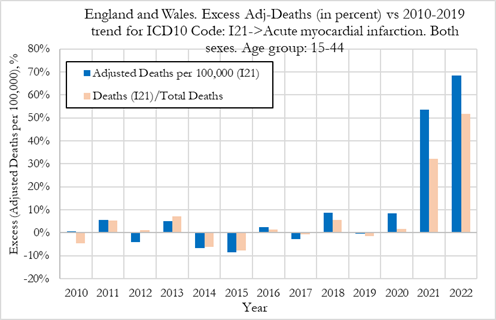
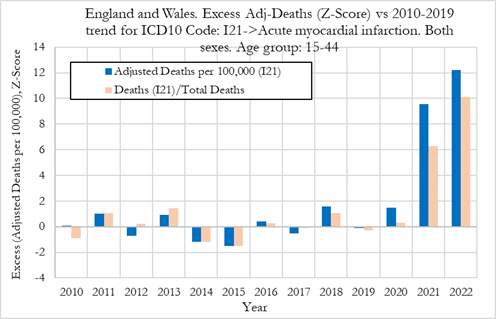
The Figures below show yearly adjusted deaths from acute myocardial infarction in England and Wales. The red dashed line shows the average from 2010 to 2019. The dotted line shows the 2015-2019 average death rate. Left: Adj-Deaths per 100,000. Right: Adj-Deaths (number).
Summary:
In the Figure (left) below we can observe that the excess deaths rates from acute myocardial infarction were +9% in 2020, then jumped to about 53% in 2021 and about 69% in 2022. In terms of statistical significance of the excess deaths, we observe from Figure (right) that for these cardiovascular conditions, in 2020, the Z-score for excess adjusted death rates was below 2 which points to a low statistical significance (within normal bounds). In 2021 however, the Z-score for excess adjusted death rates was about to 9.5 which points to a very strong signal (extreme event). In 2022 the Z-score rose to about 12, which is an extraordinarily strong signal and indicates that the excess deaths from acute myocardial infarction are statistically significant deviations from the 2010-2019 trend.
When looking at changes in the fraction of all deaths attributed to acute myocardial infarction, we observe that the fraction of deaths for these conditions were only +1% above trend in 2020, with a Z-score close to 0 showing no statistical significance. In 2021 and 2022 however, the fraction of deaths for these conditions jumped about +31% and +51% with Z-scores around 6 and 10, respectively pointing to a strong effect (extreme event).
Summary:
When looking at deaths attributed to acute myocardial infarction for males and females, shown in Figure 14, we observe that in 2020 there was a +6% excess mortality for men and +20% for women. For men the excess mortality was not a signal, with respective Z-scores of about 1.5 (low statistical significance). However, for women, the rise in excess mortality could be seen as a weak signal (with Z-score around 2) which would warrant further investigation.
In 2021 men and women suffered similar outcomes, with men experiencing a 52% deviation from trend, compared to about 66% for women. These values, constitute very strong signals, as the Z-score was around 6.0 for women and close to 10 for men.
In 2022 men suffered much worse outcomes than women, with men experiencing about 82% deviation from trend, compared to about 50% for women. The signal strength for men was very strong (with a Z-score above 15) but for women the signal was still strong albeit weaker than in 2021 (with a Z-score above 4), as shown in Figure 14-right.
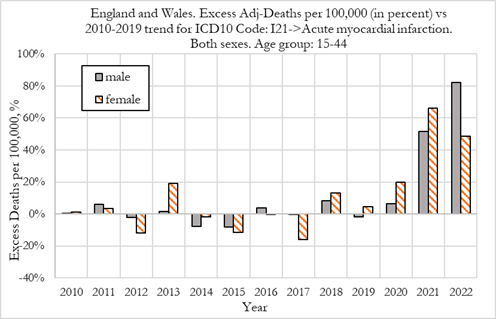
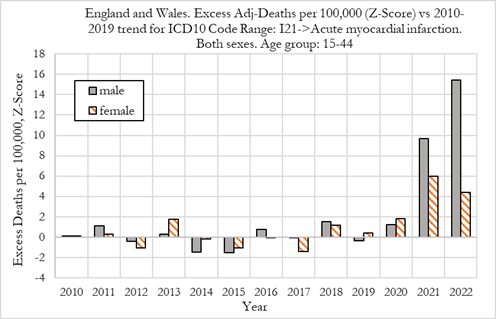
We now compare excess deaths rates from acute myocardial infarction for males and females aged 15-44, as shown in the Figure below.
We observe that in 2020 there was a +6% excess mortality for men and +20% for women. For men the excess mortality was not a signal, with respective Z-scores of about 1.5 (low statistical significance). However, for women, the rise in excess mortality could be seen as a weak signal (with Z-score around 2) which would warrant further investigation.
In 2021 men and women suffered similar outcomes, with men experiencing a 52% deviation from trend, compared to about 66% for women. These values, constitute very strong signals, as the Z-score was around 6.0 for women and close to 10 for men.
In 2022 men suffered much worse outcomes than women, with men experiencing about 82% deviation from trend, compared to about 50% for women. The signal strength for men was very strong (with a Z-score above 15) but for women the signal was still strong albeit weaker than in 2021 (with a Z-score above 4), as shown in Figure (right).
Summary:
The chart below shows an overview of the excess mortality for selected cardiovascular events, which are analysed in detail in the full report.
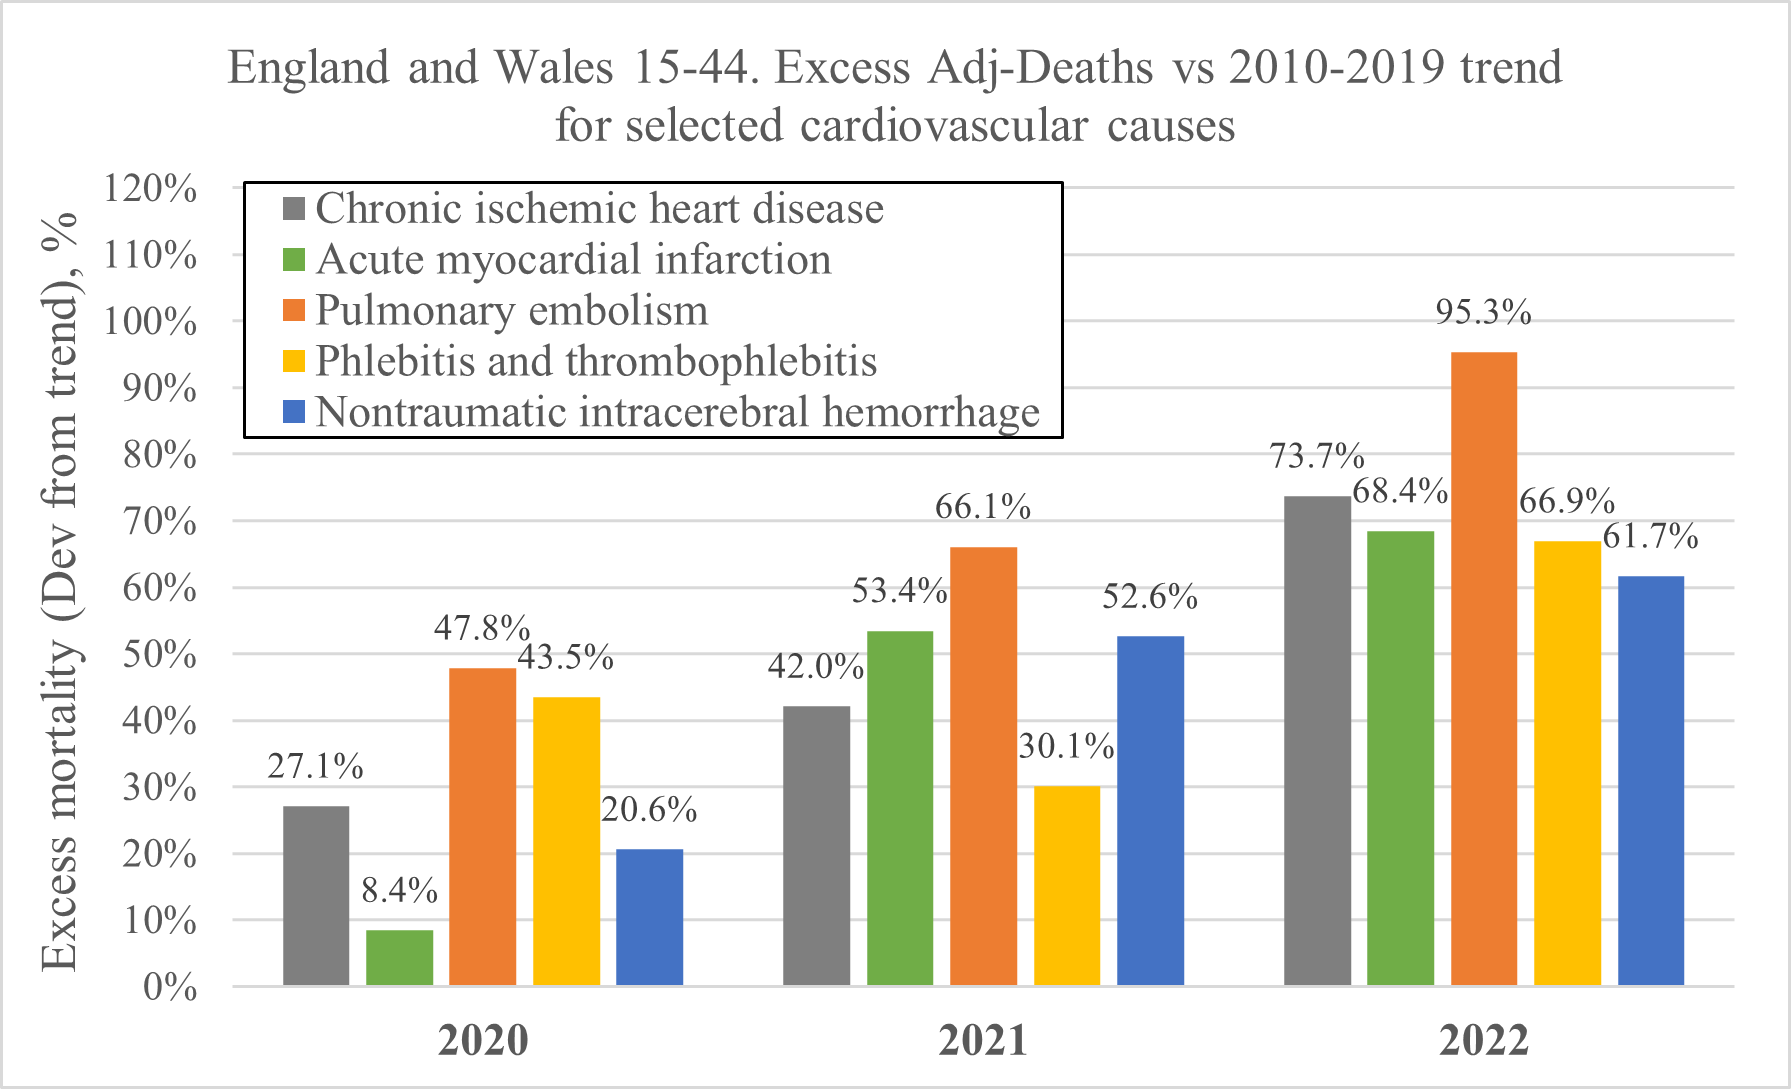
When considering the trends in mortality for different cardiovascular conditions during 2020, 2021 and 2022, it is important to consider the factors that could influence these trends. Covid-19 disease itself has been associated with harmful cardiovascular effects and would be most likely to explain any anomalies in 2020, alongside potentially the disruption to healthcare provision. However, over time, the SARS-CoV-2 virus variants have been thought to become less virulent, so we would expect mortality from cardiovascular disorders to tend back towards its normal trend during 2021 and 2022. If the opposite occurred, we would need to consider whether other factors were at play.
The vaccine programmes introduced in 2021 have to be included as one such factor, as we know from analysis carried out by Michels et. al., of the Pfizer clinical trials, that 6 months after vaccination/placebo, 12 subjects died of a cardiac event; 9 in the vaccination group and only 3 in the placebo. This represents a clear signal that vaccination with the mRNA vaccine could have negative consequences for cardiac mortality.
The detailed analysis of the summary results shown in Table 2 of the full report are beyond the scope of this report and should be investigated with detailed care by medical doctors that work in the field. However, some noticeable patterns are obvious at first glance, which we’ll describe next.
The 2 main causes of cardiovascular deaths for 15 to 44 year-olds in the UK were chronic ischemic heart disease (I25) and acute myocardial infarction (I21), which accounted respectively for 16.5% and 14.9% of cardiovascular deaths in 2019. Altogether these two causes represent about 31.4% of cardiovascular deaths.
One of the noticeable patterns from Table 2 (see full report) is that the deaths rates for both acute myocardial infarction and chronic ischaemic heart disease increased substantially in 2020, 2021 and 2022. In 2022, death rates from acute myocardial infarction were 68.4% above trend, while death rates for chronic ischaemic heart disease were 73.7% above trend. By 2022, both conditions had similar increases relative to pre-2020 trends.However, we also observe that while chronic ischaemic heart disease rose by 27.1% in 2020, with a high statistical significance (Z-score of about 6), as shown in section 5.2; acute myocardial infarction death rates were only about 8.4% above trend, with low statistical significance (Z-Score of about 1.5). This means that individuals with prior heart conditions (chronic heart disease) already experienced a rise in death rate in 2020, before the introduction of the mRNA inoculations, but no significant rise in acute myocardial infarction. Acute myocardial infarction only rose significantly from 2021, with a 53.4% deviation from trend, after the Covid-19 shots were introduced.
The results in Table 2 (see full report) show that overall cardiovascular diseases saw explosive changes in 2021 and 2022 relative to the 2010-2019 trend that appear to be affecting men in a disproportionate manner. For example, with the two main cardiovascular diseases namely chronic ischaemic heart disease and acute myocardial infarction that account for about 31.4% of cardiovascular deaths, we see men having worse outcomes than women.
Additionally, nontraumatic intracerebral haemorrhage saw enormous rise in death rates in 2021 and 2022 for men, while women experienced almost no change. The mechanisms behind this pattern are unclear and require further investigation.
The pattern of behaviour for deaths from pulmonary embolisms and phlebitis and thrombophlebitis was similar in 2020, 2021 and 2022. Pulmonary embolisms saw +47.8% excess deaths rates in 2020 while phlebitis and thrombophlebitis the excess death rate was +43.5%, with Z-scores of about 5 and 4, respectively, indicating strong signals.
However, while excess death rates from pulmonary embolism continued accelerating in 2021 and 2022 (+66.1% and +95.3%, respectively), excess death rates from phlebitis and thrombophlebitis were more subdued in 2021, then accelerated again in 2022 (+30.1% and +66.9% respectively).
When comparing women and men, we observe that for these conditions, both experienced comparable rises in death rates.
In summary, it is interesting to notice that both these conditions saw significant increases (strong signals) of death rates already in 2020, before the Covid-19 vaccination rollout, indicating that they were likely related to the Covid-19 disease. The re-acceleration of excess deaths in 2022 points to other effects at play as the virus is known to have become less virulent and more contagious over time, with the successive variants.
Another pattern of note from Table 2 (see full report) is the rise in the deaths rates from nontraumatic intracerebral haemorrhage which was dramatic in men but almost negligible in women.
For men, excess deaths rates from nontraumatic intracerebral haemorrhage were +32.3%, +88.0% and 103.1% in 2020, 2021 and 2022, respectively. The Z-score for excess adjusted death rates were about to 5.2 and 6, in 2021 and 2022 respectively, which point to very strong signals (extreme events). In 2020, the Z-score for the excess death rates was already pointing towards a weak signal, with a Z-score close to 2, which indicates some statistical significance.
For women, excess deaths rates from nontraumatic intracerebral haemorrhage were +4.4%, +6.8% and +16.1% in 2020, 2021 and 2022, respectively. These values did not have statistical significance which indicate that no signal was present in changes in death rates for these conditions.
Even though nontraumatic intracerebral haemorrhage deaths accounted for only about 5.4% of total cardiovascular deaths for 15 to 44 year-olds in the UK, these rises in death rates in men, but not in women needs further investigation.
